Elasticity of Demand (PED & YED)
Contents: 12 sections
Price elasticity of demand (PED)
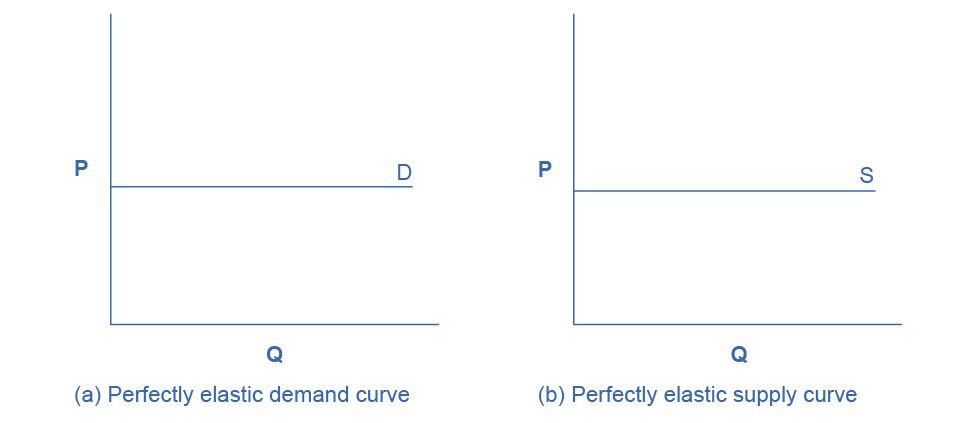
PED measures how responsive quantity demanded is to a change in a good's own price.
PED = percentage change in quantity demanded ÷ percentage change in price
Because the demand curve slopes downwards, price and quantity always move in opposite directions, so PED is negative. Economists discuss the absolute value and treat the minus sign as a property of the law of demand rather than as information about responsiveness.
| Value | Name | What it means | ||
|---|---|---|---|---|
| \ | PED\ | > 1 | Elastic | Quantity responds proportionately more than price |
| \ | PED\ | < 1 | Inelastic | Quantity responds proportionately less than price |
| \ | PED\ | = 1 | Unit elastic | Quantity responds proportionately the same |
| \ | PED\ | = 0 | Perfectly inelastic | Quantity does not change at all (vertical curve) |
| \ | PED\ | = ∞ | Perfectly elastic | Any price rise cuts quantity demanded to zero (horizontal curve) |
Key definitions
| Term | Exam-ready definition |
|---|---|
| PED | Responsiveness of quantity demanded to a change in the good's own price. |
| YED | Responsiveness of demand to a change in consumer income. |
| Normal good | Positive YED: demand rises as income rises. |
| Inferior good | Negative YED: demand falls as income rises. |
| Total revenue | Price × quantity sold. |
PED varies along a straight-line demand curve
This is the single most misunderstood point in the topic, and examiners test it directly.
On a straight-line demand curve the slope is constant, but PED is not. PED is a ratio of percentage changes, and the base values change as you move along the curve:
- Upper section (high price, low quantity): a price change is a small percentage of a large price, while the quantity change is a large percentage of a small quantity. Demand is elastic.
- Midpoint: unit elastic.
- Lower section (low price, high quantity): the reverse holds. Demand is inelastic.
So "the demand curve is elastic" is never a complete statement, elasticity depends on where on the curve you are.
Note the contrast with supply, where a straight line through the origin has PES = 1 all the way along. Demand and supply behave differently in this respect, and confusing the two rules is a reliable way to lose a mark.
The midpoint method
Percentage changes differ depending on which end you start from, a rise from \$10 to \$12 is 20%, but the fall from \$12 back to \$10 is 16.7%. The midpoint formula removes that asymmetry by using the average as the base:
% change = (new − old) ÷ [(new + old) ÷ 2] × 100
Use whichever method the question specifies. If it does not specify, the simple method is standard, but say which you have used.
Determinants of PED
- Substitutes: the dominant determinant. More, and closer, substitutes make demand more elastic, because consumers have somewhere to go when price rises. This is why demand for a brand of coffee is far more elastic than demand for coffee in general.
- Necessity versus luxury: necessities have inelastic demand; luxuries are elastic and easily postponed.
- Proportion of income: a good absorbing a large share of income (a car, a holiday) attracts more scrutiny, so demand is more elastic. Salt is inelastic partly because nobody notices the price.
- Time: demand is more elastic in the long run. After an oil price rise, drivers cannot change car overnight, but over several years they can switch to fuel-efficient or electric vehicles.
- Addictiveness and habit: makes demand inelastic, which is exactly why tobacco and alcohol are attractive tax bases.
- Definition of the market: the narrower the definition, the more elastic the demand.
PED and total revenue
Total revenue is price × quantity, and a price change moves those two in opposite directions. Which effect dominates is decided by PED.
| Demand | Price rises | Price falls | ||
|---|---|---|---|---|
| Elastic (\ | PED\ | > 1) | Revenue falls | Revenue rises |
| Inelastic (\ | PED\ | < 1) | Revenue rises | Revenue falls |
| Unit elastic | Unchanged | Unchanged |
The mechanism, written as a chain the examiner can credit:
- Price rises
- quantity demanded falls
- if demand is inelastic, the proportionate fall in quantity is smaller than the proportionate rise in price
- total revenue rises.
Why this matters beyond the firm. A government taxing a good with inelastic demand raises substantial revenue but changes consumption little, good for the Treasury, weak as a public-health measure. A tax on a good with elastic demand does the opposite. The same calculation explains why indirect taxes tend to be regressive on necessities: low-income households cannot avoid them.
PED and tax incidence
Who actually bears an indirect tax is settled by the relative elasticities of demand and supply, not by who hands the money to the government.
The more inelastic side of the market bears the greater share of the burden, because it has fewer alternatives and cannot escape by changing behaviour.
Push it to the limits and it becomes obvious. If demand is perfectly inelastic, consumers pay the entire tax, they buy the same quantity whatever the price. If demand is perfectly elastic, producers absorb all of it, since any attempt to pass it on loses every customer.
Elasticity also decides the size of the welfare loss. The more elastic either side, the more quantity falls in response to the tax, and the larger the deadweight loss. A tax on a good with very inelastic demand distorts behaviour hardly at all while raising a great deal of revenue, which is precisely why governments tax such goods, and precisely why those taxes are poor at changing behaviour.
Income elasticity of demand (YED)
YED = percentage change in demand ÷ percentage change in income
Note that YED shifts the whole demand curve, whereas PED describes movement along it.
- Normal goods: YED > 0. Necessities sit between 0 and 1 (demand rises, but proportionately less than income). Luxuries have YED > 1.
- Inferior goods: YED < 0. Demand falls as income rises, bus travel, supermarket value ranges, second-hand clothing.
Application. YED explains structural change in growing economies. As incomes rise, demand for primary products (YED low) grows slowly while demand for manufactures and services (YED high) grows quickly. That is one structural reason why economies dependent on primary-product exports can find their share of world income shrinking even as output rises, a standard evaluation point in development questions.
It also explains why the service sector expands as economies develop: services generally carry high YED, so demand for them grows faster than income, while demand for food grows more slowly. Sectoral change is YED at work across a whole economy.
Worked examples
PED and revenue. A café raises price by 10% and quantity demanded falls by 20%.
PED = −20% ÷ 10% = −2, so |PED| = 2 → elastic.
Because demand is elastic, total revenue falls. Quantify it: new revenue = 1.10 × 0.80 = 0.88 of the original, a 12% fall. Close substitutes, other cafés, making coffee at home, give customers somewhere to go.
Working backwards. A firm knows PED = −0.5 and wants to raise revenue. Since demand is inelastic, it should raise price: a 10% rise cuts quantity by only 5%, so revenue becomes 1.10 × 0.95 = 1.045, a rise of 4.5%.
Note what this does not say. Revenue is not profit. If the price rise also reduces output, costs fall too, so profit may rise by more than revenue, or the firm may lose customers permanently to rivals, which the one-period calculation cannot see.
YED. Incomes rise 8% and demand for rail season tickets rises 12%.
YED = 12% ÷ 8% = +1.5 → a normal good, and a luxury (YED > 1).
A negative case. Incomes rise 5% and demand for supermarket own-brand food falls 2%.
YED = −2% ÷ 5% = −0.4 → negative, so an inferior good.
The sign is the whole answer. A firm selling inferior goods should expect demand to fall during an economic recovery and rise during a recession, a genuinely counter-intuitive planning implication and a favourite application question.
Common exam mistakes
- Reporting PED with the minus sign and then misclassifying by sign instead of absolute value.
- Saying a price rise "always" raises revenue, it depends entirely on elasticity.
- Confusing PED (movement along the curve) with YED (a shift of the curve).
- Treating a whole demand curve as having one elasticity.
- Applying the demand rule to supply, a straight-line supply curve through the origin has PES = 1 throughout.
- Assuming whoever pays the tax to the government bears it.
- Treating revenue as profit.
- Calculating correctly and stopping. The number is worth little until it is interpreted.
- Confusing an inferior good with a Giffen good, or with a cheap good.
Exam technique
Always calculate, then interpret, then apply. A bare number earns the calculation mark and nothing else. Say whether demand is elastic or inelastic, then state the decision it changes, a firm's pricing, a government's tax revenue, a farmer's income.
Where a percentage change in revenue is wanted, multiply the two factors rather than adding the percentages: 1.10 × 0.80, not 10% − 20%. Adding gives the right direction and the wrong number.
For 10-mark questions, define PED precisely, give the formula, and build one clear chain from a price change to the revenue outcome. For 15-mark questions, the evaluation almost always lives in the elasticity itself: how confident are we in the estimate, does it hold in the long run, does it differ across income groups?
Elasticity estimates come from past data and may not hold after a large price change, or once substitutes appear. Saying so is a strong, syllabus-relevant evaluative point rather than a generic caveat.
Quick revision
- PED = %ΔQd ÷ %ΔP; judge by absolute value: >1 elastic, <1 inelastic.
- Substitutes are the main determinant; time makes demand more elastic.
- Inelastic + price rise → total revenue rises. Elastic + price rise → revenue falls.
- Quantify revenue by multiplying the factors: 1.10 × 0.80 = 0.88, a 12% fall.
- PED varies along a straight-line demand curve: elastic at the top, unit elastic at the midpoint, inelastic at the bottom.
- The more inelastic side of a market bears more of an indirect tax.
- More elastic demand or supply → larger deadweight loss from a tax.
- YED: positive for normal goods, negative for inferior; luxuries have YED > 1.
- High-YED services expand as economies develop; low-YED primary products lag.
- PED describes movement along the curve; YED shifts it.
Check you have it
Cross-board concept practice · originally a CIE 9708 question, used here because the concept is the same. It is not IB Economics past-paper material.
Question 1
The diagram shows the relationship between the price and the total expenditure on a good.
price
O total expenditure
Which statement is correct?

Answer: C.
Cross-board concept practice · originally a CIE 9708 question, used here because the concept is the same. It is not IB Economics past-paper material.
Question 2
The diagram shows the demand curve for a product. If the rectangle OLMN is equal in area to the rectangle OPQR, which statement is correct?
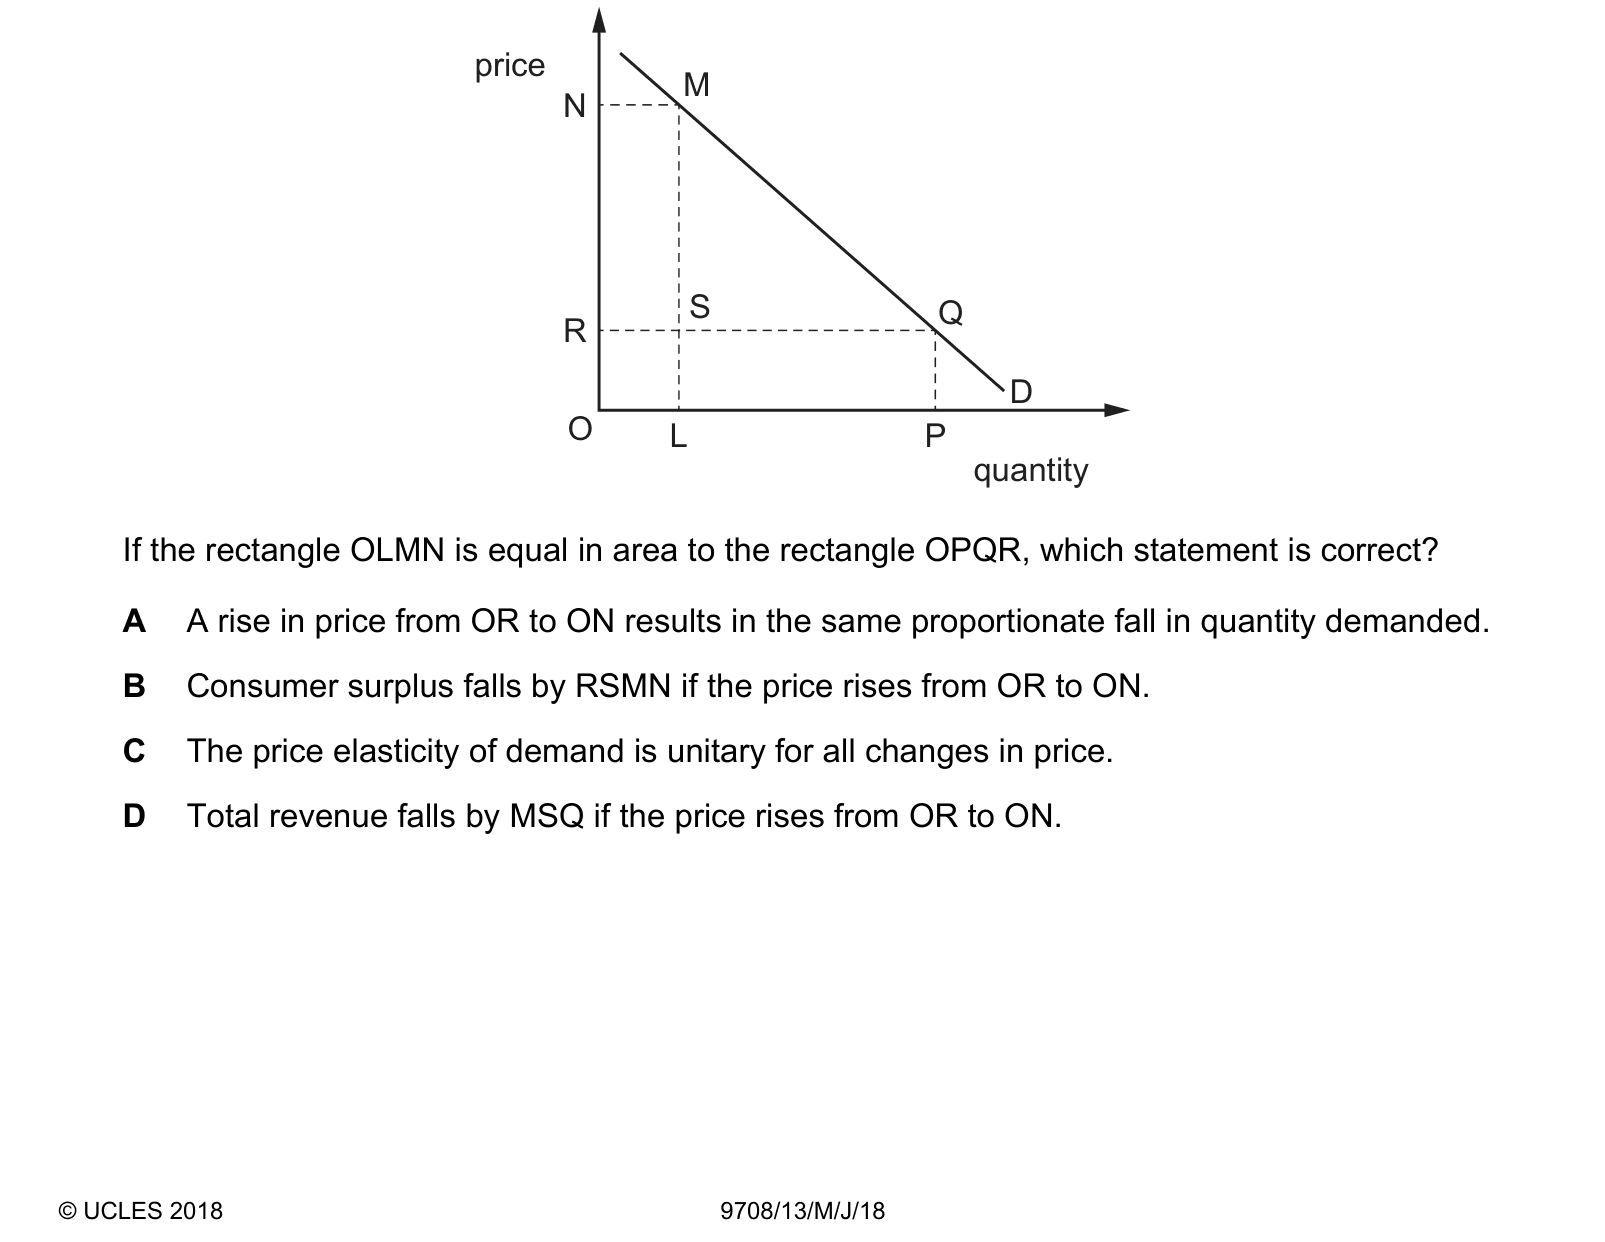
Answer: A.
Cross-board concept practice · originally a CIE 9708 question, used here because the concept is the same. It is not IB Economics past-paper material.
Question 3
The price elasticity of the supply of yoghurt is estimated to be +1.5.
If the demand for yoghurt rises and price rises by 20%, how much more will be supplied to the market?
Answer: D.
Price elasticity of supply is the percentage change in quantity supplied divided by the percentage change in price. Rearranging, the percentage change in quantity supplied equals PES multiplied by the percentage change in price: 1.5 × 20% = 30%. Because PES is greater than 1, supply is elastic, so quantity responds proportionately more than price, which is why the answer must be larger than 20%.
Why the other options are wrong:
- A, 0.3%, and B, 3.0%, come from misplacing a decimal point, multiplying 1.5 by 0.2 and then reading the result as a percentage rather than as a proportion of the original percentage.
- C, 13.3%, comes from dividing 20 by 1.5 instead of multiplying. This is the most common error in elasticity calculations, and it is easy to catch: since supply is elastic, the quantity change must exceed the price change, so any answer below 20% cannot be right.
What the syllabus asks for on this topicSyllabus points
Syllabus points
- Calculate and interpret price elasticity of demand (PED).
- Explain the determinants of PED and the link to total revenue.
- Calculate and interpret income elasticity of demand (YED) and classify goods.
- Apply elasticity to firm pricing, government taxation and primary-product markets.
Related IB Economics topics
Not the topic you were looking for? Describe what you are stuck on in your own words and we will take you to the notes that answer it.