Equity in the Distribution of Income
Contents: 13 sections
Equity versus equality
- Equality means everyone receives the same.
- Equity means the distribution is fair, which may not be the same as equal.
Most people accept that some inequality is equitable: rewarding longer training, greater effort or higher risk is widely regarded as fair, and complete equality would remove the incentive to do any of those things. Equity is therefore a normative judgement, and reasonable people disagree about where the line falls. Saying this explicitly is a mark of a sophisticated answer.
Income versus wealth
- Income is a flow, earnings received over a period: wages, rent, interest, profit, transfers.
- Wealth is a stock, the value of assets owned at a point in time: property, shares, savings, pensions.
Wealth is almost always distributed far more unequally than income, and the two reinforce each other: wealth generates income, which can be saved to accumulate further wealth. That feedback loop is why inequality can persist and widen across generations.
Measuring inequality
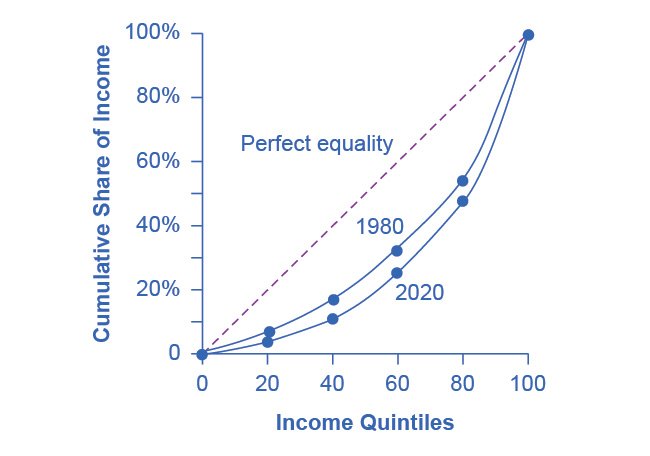
The Lorenz curve
A graph plotting the cumulative percentage of income received against the cumulative percentage of the population, ranked from poorest to richest.
- The 45° line represents perfect equality, the poorest 20% receive 20% of income, and so on.
- The actual Lorenz curve lies below it. The further it bows away from the 45° line, the greater the inequality.
Reading a point off the curve is a standard data-response task, and the wording matters. A point at (40, 12) means the poorest 40% of households receive 12% of total income. Everything is cumulative and ranked poorest-first, so the reading is always "the bottom x per cent receive y per cent".
Note a limitation that follows directly from the geometry: two Lorenz curves that cross cannot be ranked unambiguously. One country may be more unequal at the bottom and the other at the top, and a single comparison cannot capture that.
The Gini coefficient
A single number derived from the Lorenz curve:
Gini = area between the 45° line and the Lorenz curve ÷ total area under the 45° line
It runs from 0 (perfect equality) to 1 (perfect inequality, where one person receives everything). Higher Gini means more unequal.
Its limitations, which make good evaluation:
- A single number hides where in the distribution inequality lies. Two countries can share a Gini while one has extreme poverty and the other extreme wealth concentration.
- It usually measures income, not wealth, so it understates overall inequality.
- It may be measured before or after taxes and transfers, and the two give very different pictures. Always check which.
- It says nothing about absolute living standards. A poor country can have a low Gini.
Progressive, proportional and regressive taxation
The tax system is the main instrument for changing the distribution, and the three types are distinguished by what happens to the average rate as income rises, not by the amount paid.
| Type | Average rate as income rises | Effect on inequality |
|---|---|---|
| Progressive | Rises | Reduces it |
| Proportional | Constant | Leaves it unchanged |
| Regressive | Falls | Increases it |
Worked comparison. A country levies a 10% sales tax. Household A earns \$20,000 and spends \$18,000 of it; Household B earns \$100,000 and spends \$50,000.
A pays 10% × \$18,000 = \$1,800, which is 9% of its income.
B pays 10% × \$50,000 = \$5,000, which is 5% of its income.
B pays nearly three times as much in absolute terms, yet the tax takes a smaller share of its income. The average rate falls as income rises, so the sales tax is regressive, even though the rate is identical for everyone. The mechanism is that poorer households must spend a larger proportion of their income, so a tax on spending reaches more of it.
This is why indirect taxes tend to worsen the distribution while direct income taxes can improve it, and why a question about VAT or excise duties is usually asking about equity.
Measuring poverty
- Absolute poverty: income below a level needed for basic needs, measured against a fixed international line. It can, in principle, be eliminated.
- Relative poverty: income below a proportion of the national median, typically 50% or 60%. It measures exclusion relative to prevailing norms and cannot be eliminated by growth alone, since the benchmark rises with average income.
A country can reduce absolute poverty through growth while relative poverty is unchanged or worsens, a distinction data-response questions test frequently.
Multidimensional measures go further, counting deprivation in health, education and living standards alongside income, on the argument that poverty is not only a shortage of money. They matter because a household just above an income line may still lack clean water, schooling or electricity.
Causes of inequality
- Differences in human capital: education, training, skills, and unequal access to them.
- Ownership of wealth-generating assets, which is highly concentrated and inherited.
- Discrimination by gender, ethnicity, age or disability.
- Unequal opportunity: access to quality schooling and healthcare depends on family income.
- Technological change and globalisation, which raise returns to high-skilled workers and depress demand for routine labour.
- Weaker unions and labour protections, reducing bargaining power at the lower end.
- Regressive tax systems and inadequate transfers.
- Market power, allowing owners to capture a larger share of value created.
The poverty cycle
These causes compound into a self-reinforcing trap, and naming the mechanism is worth more than listing causes:
- Low income
- low saving
- little investment in education, health or capital
- low productivity
- low income again.
The cycle operates at both household and national level, and it is the central argument for intervention: a market left alone does not break it, because the households who would benefit most from investing in themselves are precisely those who cannot afford to.
A related trap operates through the benefit system. If benefits are withdrawn steeply as earnings rise, a household can face a very high effective marginal tax rate, keeping little of each extra pound earned. That is the poverty trap, and it is a genuine efficiency argument against badly designed transfers, distinct from the general incentive objection.
Consequences
- Lower living standards and poverty for those at the bottom, with knock-on effects on health, nutrition and life expectancy.
- Reduced social mobility. Where opportunity depends on family income, talent is wasted, an efficiency loss, not just a fairness problem.
- Lower economic growth, since poorer households have a higher marginal propensity to consume; concentrating income at the top can reduce aggregate demand.
- Under-investment in human capital, because poor families cannot fund education.
- Social and political instability, with associated effects on investment and crime.
- Higher government spending on benefits and services, with fiscal consequences.
The strongest of these for an economics answer is the efficiency one. Inequality is usually argued about as a fairness question, but wasted talent and under-investment in human capital reduce an economy's productive capacity, so reducing inequality can raise growth rather than trade off against it.
Policies to reduce inequality and poverty
| Policy | Mechanism | Limitation |
|---|---|---|
| Progressive income tax | Higher earners pay a higher average rate, narrowing post-tax differences | May reduce work and investment incentives; avoidance and evasion |
| Transfer payments | Benefits, pensions, child support raise the incomes of the poorest | Cost; possible disincentive if withdrawal rates are steep |
| Minimum wage | Raises the wage floor | May cause unemployment if set well above equilibrium; helps only those in work |
| State provision of education and healthcare | Raises human capital and equalises opportunity | Expensive; effects take a generation |
| Wealth, inheritance and capital gains taxes | Address the stock, not just the flow | Hard to value and easy to relocate |
| Progressive infrastructure and regional policy | Reduces geographic disadvantage | Slow, and expensive |
The central trade-off is between equity and efficiency: redistribution may blunt incentives to work, save and take risks. How large that effect really is remains empirically contested, and saying so, rather than asserting a large disincentive, is the more defensible position.
Note also that some policies do both: education spending raises equity and long-run productive capacity, so it is not simply a transfer.
Real-world examples
- The Nordic economies are the standard case that high taxation and extensive transfers can coexist with high income levels and strong competitiveness, evidence against the assumption that redistribution necessarily costs growth.
- South Africa and Brazil are frequently cited among the most unequal large economies, illustrating how historical structures and unequal access to education can entrench a distribution that growth alone does not correct.
- Conditional cash transfer programmes in Latin America, which pay families on condition that children attend school and receive healthcare, are a useful example of a policy aimed at breaking the poverty cycle rather than only relieving its symptoms.
Worked example
A country's Gini coefficient is 0.48 before taxes and transfers, and 0.33 after.
The fall from 0.48 to 0.33 shows that the tax and benefit system substantially reduces measured inequality: progressive taxation takes proportionately more from higher earners, while transfers raise the incomes of the poorest.
On the Lorenz curve, the post-tax curve lies closer to the 45° line than the pre-tax curve.
Evaluation. The remaining 0.33 still represents significant inequality. The figures say nothing about wealth, which is more unequally held, so total inequality is understated. Nor do they reveal where the inequality sits, whether the gap is between the middle and the top, or between the bottom and everyone else, which matters enormously for choosing a policy. And the redistribution has a cost: it must be funded, and may affect incentives, though the size of that effect is disputed.
A further point often missed. A Gini that falls after redistribution says the system is redistributive; it does not say whether it is redistributive enough, because that is a normative question about equity rather than a measurement question about equality. Recognising which of the two a question is asking is often the difference between an answer that analyses and one that judges.
Common exam mistakes
- Treating equity and equality as synonyms.
- Confusing income (a flow) with wealth (a stock).
- Saying a higher Gini means less inequality, it means more.
- Confusing absolute with relative poverty, or claiming growth eliminates relative poverty.
- Confusing progressive with proportional taxation. Progressive means the average rate rises with income.
- Judging whether a tax is regressive by the amount paid rather than the share of income.
- Reading a Lorenz point as a share of the population rather than a cumulative income share.
- Listing policies without weighing them against the efficiency trade-off.
Exam technique
Draw the Lorenz curve with both axes as cumulative percentages, the 45° line, and the actual curve bowing below it. If comparing before and after redistribution. Draw two curves and state which lies closer to the line.
Define equity as a normative concept early, it signals that you understand this topic involves value judgements as well as analysis.
When a tax is described, work out the average rate at two income levels before classifying it. That calculation settles progressive, proportional or regressive in one line, and it is what the question is testing.
For evaluation: the equity–efficiency trade-off, the limitations of the Gini coefficient, the distinction between absolute and relative poverty, whether policies address income or wealth, and the time frame (education is slow but durable; transfers are fast but do not change underlying causes).
Quick revision
- Equality = the same; equity = fair. Equity is a normative judgement.
- Income is a flow; wealth is a stock and is far more unequally distributed.
- Lorenz curve: the further from the 45° line, the more unequal; crossing curves cannot be ranked.
- Gini: 0 = perfect equality, 1 = perfect inequality. Higher = more unequal.
- Progressive = average rate rises; regressive = average rate falls. Sales taxes are regressive.
- Absolute poverty can be eliminated; relative poverty is measured against the median.
- The poverty cycle: low income → low investment → low productivity → low income.
- Inequality can reduce growth, since poorer households have a higher MPC, and wastes talent.
- Policies: progressive tax, transfers, minimum wage, education and health provision, wealth taxes.
- Central trade-off: equity versus incentives, but the size of the disincentive is contested.
Check you have it
Cross-board concept practice · originally a CIE 9708 question, used here because the concept is the same. It is not IB Economics past-paper material.
Question 1
Which government policy has greater equality as one of its consequences?
Answer: C.
Cross-board concept practice · originally a CIE 9708 question, used here because the concept is the same. It is not IB Economics past-paper material.
Question 2
What is likely to move an economy’s aggregate demand curve to the right?
Answer: C.
A depreciation makes exports cheaper in foreign currency and imports dearer at home. Export volumes rise and import volumes fall, so net exports (X – M) increase. Since net exports are a component of aggregate demand, AD shifts to the right.
Why the other options are wrong:
- A, a fall in income equality, means the distribution becomes more unequal. Since richer households have a lower marginal propensity to consume, shifting income towards them tends to reduce total consumption, moving AD left.
- B, a fall in incomes abroad, reduces foreign buyers' ability to purchase this country's exports. Export demand falls, so AD shifts left.
- D, a fall in the government budget deficit, means less spending or more taxation. Either is contractionary, so AD shifts left.
Cross-board concept practice · originally a CIE 9708 question, used here because the concept is the same. It is not IB Economics past-paper material.
Question 3
Which policy is likely to be the least effective means of producing a more equal distribution of income amongst households?
Answer: A.
What the syllabus asks for on this topicSyllabus points
Syllabus points
- Distinguish equity from equality.
- Explain how income and wealth inequality are measured (Lorenz curve, Gini coefficient).
- Distinguish progressive, proportional and regressive taxation.
- Explain the causes and consequences of inequality and poverty.
- Evaluate policies to reduce inequality and poverty.
Related IB Economics topics
Not the topic you were looking for? Describe what you are stuck on in your own words and we will take you to the notes that answer it.