Monetary Policy
Contents: 10 sections
The role of the central bank
A central bank conducts monetary policy, usually independently of government, to achieve macroeconomic goals, above all low and stable inflation, commonly a target around 2%, while supporting growth and employment.
Independence matters for a specific economic reason worth stating in an answer: an elected government has an incentive to stimulate the economy before an election, which raises inflation expectations and makes inflation harder and more costly to control later. Delegating the decision to a body with a clear mandate makes the commitment to low inflation credible, and credibility is itself what anchors expectations.
Its main instruments:
- the policy interest rate (the primary tool)
- open market operations: buying or selling government bonds to change the money supply
- reserve requirements on commercial banks
- quantitative easing (QE): large-scale asset purchases, used when rates are already near zero
How the tools actually work
Open market operations are the mechanism behind the headline rate. When the central bank buys bonds, it pays commercial banks with newly created reserves: the money supply expands, banks have more to lend, and interest rates fall. Selling bonds does the reverse. Bond prices and interest rates move inversely, so "buying bonds" and "pushing rates down" describe the same event.
Quantitative easing extends this once the policy rate is already near zero. The central bank buys assets on a large scale, typically government bonds, sometimes corporate ones, from financial institutions. Three effects follow: the money supply expands; bond prices rise so long-term yields fall, not just the short-term policy rate; and asset holders who sold may rebalance into other assets, raising prices there too. The intended result is cheaper borrowing across the whole economy, plus a wealth effect on consumption.
The recurring criticism is worth having ready: QE raises asset prices, and assets are held disproportionately by the already wealthy, so it tends to widen wealth inequality even when it succeeds at its macroeconomic objective.
Nominal and real interest rates
Real interest rate ≈ nominal interest rate − inflation rate
The real rate is what determines borrowing and saving decisions, because it measures the cost in purchasing power. This distinction has a sharp implication for policy: a central bank can cut the nominal rate to zero and still leave the real rate high if inflation is negative. In deflation, a nominal rate of 0% with prices falling 2% means a real rate of +2%, genuinely contractionary, at exactly the moment stimulus is needed. That is the mechanism behind the liquidity trap below.
How interest rates affect AD
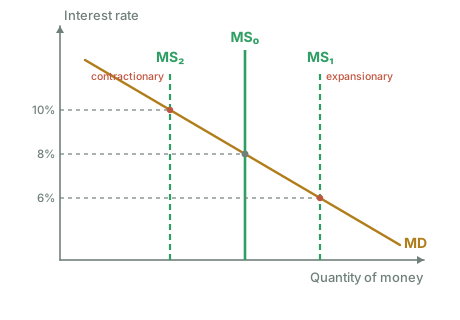
The transmission mechanism is what examiners want traced, link by link. A change in the policy rate works through several components of AD at once:
- Consumption. Lower rates cut the cost of borrowing and reduce the reward for saving → households borrow and spend more, save less → C rises. There is also a wealth effect: lower rates raise asset and house prices, and households spend part of that perceived gain.
- Investment. Lower rates reduce the cost of finance, so projects that were marginal now clear the hurdle rate → I rises.
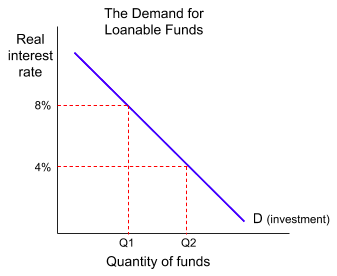
- Exchange rate. Lower rates make domestic assets less attractive to foreign investors → capital outflows → the currency depreciates → exports cheaper, imports dearer → net exports rise.
Written as a chain:
- The central bank cuts the policy rate
- commercial banks lower lending rates
- borrowing becomes cheaper for households and firms
- consumption and investment rise
- AD shifts right
- real output and employment rise, with upward pressure on the price level depending on spare capacity.
The size of the final effect depends on the multiplier and on where the economy sits on the AS curve.
Which channel is strongest depends on the economy. In a country with widespread variable-rate mortgages, the consumption channel bites quickly and hard. In a small open economy, the exchange-rate channel usually acts fastest of all. Saying which channel dominates and why is a mark of a strong answer.
Expansionary versus contractionary
| Stance | Action | Aim | Risk |
|---|---|---|---|
| Expansionary | Cut interest rates, QE | Raise AD in a recession, cut unemployment | Inflation if capacity is limited; asset bubbles |
| Contractionary | Raise interest rates | Reduce AD to control demand-pull inflation | Slower growth, higher unemployment |
Monetary compared with fiscal policy
Most 15-mark questions on either policy are really asking you to compare them.
| Monetary policy | Fiscal policy | |
|---|---|---|
| Who decides | Central bank, usually independent | Government |
| Speed of decision | Fast: scheduled meetings | Slow: annual, politically contested |
| Speed of effect | Slow: up to ~18 months | Faster once enacted, but implementation lags |
| Targeting | Blunt: affects the whole economy | Can be aimed at regions, sectors, groups |
| Effect on equity | Indirect, often regressive via asset prices | Direct, through progressive tax and transfers |
| Effect on LRAS | Little | Capital spending raises potential output |
| Main constraint | Zero lower bound; cost-push inflation | Debt sustainability; political will |
The honest conclusion is usually that they are complements rather than substitutes: monetary policy is the routine stabiliser, and fiscal policy takes over when the zero lower bound binds or when the problem is distributional.
Evaluation
Strengths
- Flexible. Rates can be changed at short notice and adjusted incrementally, unlike a budget set annually.
- Insulated from the political cycle, which makes the inflation commitment credible.
- Effective at anchoring expectations. If firms and workers believe inflation will stay near target, they set prices and wages accordingly, and the belief becomes self-fulfilling.
- Reversible. A rate change can be undone at the next meeting; a hospital cannot be un-built.
Limitations
- Time lags. Monetary policy is often said to work with "long and variable lags", commonly estimated at up to around 18 months. A central bank must therefore act on a forecast, and forecasts can be wrong.
- The liquidity trap. When rates are already near zero, further cuts cannot stimulate spending; if confidence is low, households save regardless of how cheap borrowing is. This is why QE was reached for after 2008.
- Powerless against cost-push inflation. If inflation comes from an oil shock or a supply disruption, raising rates does nothing to the cause, it merely suppresses demand, worsening output and unemployment while the price shock works through anyway.
- Uneven distributional effects. Rate cuts benefit borrowers and asset owners while penalising savers, and asset-price inflation widens wealth inequality. Rate rises hit mortgage holders hardest.
- Depends on the banking system passing rates on. If banks are repairing balance sheets, a policy-rate cut may not reach borrowers.
- Conflicts with other objectives. Controlling inflation may require accepting higher unemployment, the short-run trade-off.
Real-world examples
- After 2008, major central banks cut policy rates to near zero and, finding that insufficient, turned to quantitative easing on a large scale. This is the standard illustration of both the zero lower bound and the unconventional response to it.
- Japan has spent decades at very low rates with weak inflation, which is the clearest single case that cutting rates is not always enough to revive demand when confidence and demographics work against it.
- The inflation of the early 2020s shows the diagnostic problem directly: inflation driven substantially by supply disruption and energy prices confronted central banks with a cost-push component their instrument does not address, and they raised rates anyway to keep expectations anchored, which is a defensible reason even when the instrument cannot touch the cause.
Worked example
Facing 6% demand-pull inflation, a central bank raises its policy rate from 2% to 4%.
- Higher policy rate
- commercial lending rates rise
- borrowing costs more and saving is better rewarded
- consumption and investment fall
- AD shifts left
- the price level rises more slowly, and inflation eases towards target.
But: the effect arrives with a lag of many months, so the bank is acting on a forecast. Meanwhile growth slows and unemployment may rise, the deliberate cost of disinflation. The currency also tends to appreciate as capital flows in, which reduces net exports and reinforces the contraction while making imports cheaper (a helpful second disinflationary channel).
Check what happened to the real rate. Nominal rates rose from 2% to 4% while inflation ran at 6%, so the real rate moved from −4% to −2%. It is still negative, policy has become less expansionary, but it is not yet restrictive. That is why a central bank facing high inflation often raises rates repeatedly: the first moves only remove stimulus rather than applying brakes.
Now change one assumption. If the 6% inflation were cost-push, a global energy price spike, the same policy would do little to the cause. It would suppress demand and raise unemployment while imported energy costs continued to push prices up. Identifying the type of inflation before recommending a policy is exactly the diagnostic step top answers make.
Common exam mistakes
- Confusing monetary policy (central bank, interest rates) with fiscal policy (government, tax and spending).
- Assuming rate cuts always boost AD, ignoring lags, confidence and the liquidity trap.
- Recommending monetary policy for cost-push inflation without qualification.
- Stating the outcome ("AD rises") without tracing the transmission mechanism that earns the analysis marks.
- Forgetting the exchange-rate channel, which is often the fastest-acting one.
- Working in nominal rates when the real rate is what drives behaviour.
- Describing QE as "printing money to give to the government" rather than as asset purchases that lower yields.
- Treating the effect as certain, when it depends on the multiplier and on spare capacity.
Exam technique
Trace the transmission explicitly: policy rate → lending rates → C, I and the exchange rate → AD → output and price level. Every arrow is a step an examiner can credit, and compressing them into "lower rates raise AD" throws away most of the marks.
Draw the AD–AS diagram with axes labelled price level and real output, shift AD, and mark the new equilibrium.
For evaluation, the strongest routes are: the type of inflation (demand-pull versus cost-push), lags, the liquidity trap and the zero lower bound, distributional effects, and a comparison with fiscal policy, which acts faster to decide but is politically constrained. End with a conditional judgement rather than a summary.
Quick revision
- The central bank targets low, stable inflation, usually independently, to keep the commitment credible.
- Tools: policy rate, open market operations, reserve requirements, QE.
- Buying bonds raises their price, lowers yields and expands the money supply.
- Real ≈ nominal − inflation; a zero nominal rate is contractionary during deflation.
- Transmission: rates → C, I and the exchange rate → AD.
- Expansionary = cut rates; contractionary = raise rates.
- Limits: lags of up to ~18 months, the liquidity trap, no answer to cost-push inflation, uneven distributional effects.
- Monetary and fiscal policy are complements: routine stabilisation versus the zero bound and equity.
- Diagnose the type of inflation before recommending monetary policy.
Check you have it
Cross-board concept practice · originally a CIE 9708 question, used here because the concept is the same. It is not IB Economics past-paper material.
Question 1
A country has a target rate of inflation of 2.5% and has recently experienced the actual rate rising to 6%, with unemployment falling to very low levels.
Which policy option is most likely to be implemented?
Answer: D.
Cross-board concept practice · originally a CIE 9708 question, used here because the concept is the same. It is not IB Economics past-paper material.
Question 2
Japan is suffering from deflation. Which government policy would not help to overcome this problem?
Answer: A.
Cross-board concept practice · originally a CIE 9708 question, used here because the concept is the same. It is not IB Economics past-paper material.
Question 3
A government wants to use an expansionary monetary policy. What should the government increase?
Answer: D.
Explanation:
1. Expansionary monetary policy aims to stimulate economic growth by increasing the money supply in the economy, which can lead to lower interest rates, increased borrowing, and higher levels of investment and consumption.
2. Increasing credit regulations (option A) would be a contractionary measure, as it would restrict the availability of credit to borrowers, leading to a decrease in spending and economic activity.
3. Increasing the exchange rate (option B) typically involves a central bank intervening in the foreign exchange market to strengthen the domestic currency relative to other currencies. While a stronger currency can have some benefits, such as making imports cheaper, it is not typically a primary tool used in expansionary monetary policy.
4. Increasing the interest rate (option C) is a contractionary measure as it makes borrowing more expensive, which can reduce investment and consumption in the economy. Expansionary monetary policy usually involves lowering interest rates to encourage borrowing and spending.
Therefore, the government should increase the money supply (option D) to implement an expansionary monetary policy.
What the syllabus asks for on this topicSyllabus points
Syllabus points
- Explain the role of a central bank and the goals of monetary policy.
- Explain how changing interest rates affects aggregate demand.
- Distinguish expansionary from contractionary monetary policy.
- Explain the distinction between nominal and real interest rates.
- Evaluate the strengths and limitations of monetary policy.
Related IB Economics topics
Not the topic you were looking for? Describe what you are stuck on in your own words and we will take you to the notes that answer it.