Measuring Development
Contents: 10 sections
IB Economics · Unit 4 The Global Economy · syllabus 4.8
Single indicators, composite indicators, and the limitations of each. Questions here almost always ask you to evaluate a measure rather than just define it, so the marks sit in what an indicator misses rather than in what it counts.
Key definitions
| Term | Exam-ready definition |
|---|---|
| Single indicator | A measure of one dimension of development, such as life expectancy or the adult literacy rate. |
| Composite indicator | A measure combining several single indicators into one figure, such as the HDI. |
| GNI per capita at PPP | Gross national income divided by population, converted at purchasing power parity so that a unit of currency buys a comparable basket in every country. |
| Human Development Index | A composite index of health, education and income, scored between 0 and 1. |
Why one number is never enough
Development is multi-dimensional: it covers income, health, education, equality, freedom and environmental quality. Any single number therefore compresses several different things into one, and every compression loses something. That is not a reason to reject indicators, it is the reason IB asks you to evaluate them.
The habit worth building is to state, for any measure you quote, what it captures and what it hides. A country with rising GNI per capita and falling life expectancy is a real possibility, and an answer that notices this scores above one that reports only the income figure.
Measuring development
Because development is multi-dimensional, no single indicator captures it.
Single indicators, grouped by dimension
- Health: life expectancy at birth, infant mortality, maternal mortality, access to clean water and sanitation, doctors per thousand people.
- Education: adult literacy rate, mean years of schooling among adults, expected years of schooling for a child entering school, enrolment ratios at each level.
- Income: GNI per capita at PPP, the proportion of the population below a poverty line, the share of income held by the poorest quintile.
- Other: energy consumption per head, internet and mobile penetration, the share of the workforce in agriculture, measures of gender equality.
Each is easy to collect and easy to compare, which is their strength. Each also measures one thing only, which is their weakness. Adult literacy tells you nothing about the quality of schooling; life expectancy tells you nothing about morbidity, the years lived in poor health.
Composite indicators
The Human Development Index (HDI) combines three dimensions into a single figure between 0 and 1:
| Dimension | Indicator |
|---|---|
| A long and healthy life | Life expectancy at birth |
| Knowledge | Mean years of schooling and expected years of schooling |
| A decent standard of living | GNI per capita at PPP |
Strengths. HDI is broader than income alone; it is comparable across countries and over time; and it captures the outcomes income is supposed to buy. Two countries can have similar GNI per capita and quite different HDI, which is precisely the point of calculating it.
Limitations. It still ignores inequality within a country, because it is built from averages. It says nothing about environmental sustainability, political freedom, human rights or gender disparity, and it misses the informal economy that in many developing countries is most of the economy. Data quality varies. And collapsing three dimensions into one figure requires weighting them, which is a judgement rather than a measurement.
How the HDI is actually built
You are not asked to reproduce the United Nations methodology, but knowing its shape makes the limitations concrete rather than memorised.
Each dimension is first converted to an index between 0 and 1 against fixed minimum and maximum values, called goalposts:
Life expectancy runs from a minimum of 20 years to a maximum of 85. Expected years of schooling runs from 0 to 18, mean years from 0 to 15, and the two are averaged into one education index. Income uses the logarithm of GNI per capita, which matters: taking logs means an extra $1,000 raises the index far more for a poor country than for a rich one, capturing the diminishing contribution of income to wellbeing.
The three dimension indices are then combined as a geometric mean rather than a simple average. The consequence is worth stating in an answer: a geometric mean punishes imbalance. A country cannot offset a disastrous health score with an excellent income score, whereas a simple average would let it.
Worked example
A country reports the following.
- Life expectancy at birth: 72 years
- Expected years of schooling: 13.5
- Mean years of schooling: 8.4
Step 1: the health index
Step 2: the education index
Each schooling measure is indexed against its own goalposts, then averaged.
\qquad
(8.4 - 0) ÷ (15 - 0) = 0.560
Step 3: interpret
With a health index of 0.800 and an education index of 0.655, this country is doing considerably better on longevity than on schooling. If its income index were, say, 0.700, the geometric mean of the three would be roughly 0.716, which sits in the high human development band.
The examinable point is the comparison, not the arithmetic: the gap between 0.800 and 0.655 tells you where policy should go, and no single figure would have revealed it.
Real-world examples
- Equatorial Guinea has repeatedly recorded a GNI per capita comparable to some European countries while its HDI rank sits more than eighty places lower, because oil revenue accrues to very few people and health and education outcomes stayed poor. It is the standard illustration that income per head is a mean.
- Cuba and Sri Lanka have long recorded life expectancy and literacy well above what their income per head would predict, because public spending was directed at health and education. Development improved without proportionate growth.
- The United States ranks lower on the inequality-adjusted HDI than on the HDI itself, which is exactly what the adjustment is designed to reveal.
(HL) Beyond the HDI
Other composite measures exist because the HDI's limitations are well known.
- Inequality-adjusted HDI (IHDI) discounts each dimension by the inequality within it. Where distribution is even, IHDI is close to HDI; where it is unequal, the gap between the two is itself the finding.
- Gender Inequality Index (GII) measures loss in achievement from disparity in reproductive health, empowerment and labour market participation.
- Multidimensional Poverty Index (MPI) counts deprivation directly across health, education and living standards, at the household level, rather than inferring it from income. A household is identified as poor by what it lacks, not by a monetary threshold.
- Happy Planet Index divides wellbeing and life expectancy by ecological footprint, so a country cannot score well by consuming the future.
Naming one of these alongside the HDI, and saying which limitation it addresses, is a reliable way to turn a description into evaluation.
Common exam mistakes
- Quoting GDP per capita as a development measure without noting that it is a mean and says nothing about distribution.
- Describing the HDI without naming its three dimensions: health, education and income.
- Forgetting purchasing power parity when comparing incomes across countries, which overstates the gap between rich and poor economies.
- Treating any single composite index as sufficient, when the point of having several is that each misses something.
- Listing limitations generically rather than tying them to the data in front of you.
Exam technique
- If the question gives you data for two countries, compare them on at least two dimensions before concluding. A difference on one indicator alone is not evidence about development.
- When asked to evaluate a measure, structure it as what it captures, what it omits, and which alternative measure covers the omission.
- Say "GNI per capita at PPP" rather than "income". The qualifier is a mark.
- Where a country's income rank and HDI rank diverge sharply, say so explicitly and explain the divergence. That is usually the whole point of the data provided.
Quick revision
- Single indicators: GNI per capita at PPP, life expectancy, adult literacy, infant mortality.
- Composite indicators: HDI from health, education and income, scored 0 to 1.
- HDI uses a geometric mean, so weakness in one dimension cannot be bought off with strength in another.
- HL variants: IHDI for inequality, GII for gender, MPI for direct deprivation.
- Every measure has a limitation, and naming it is where the marks are.
Check you have it
Cross-board concept practice · originally a CIE 9708 question, used here because the concept is the same. It is not IB Economics past-paper material.
Question 1
Which indicator is least likely to be used when measuring the comparative economic development of a country?
Answer: D.
Cross-board concept practice · originally a CIE 9708 question, used here because the concept is the same. It is not IB Economics past-paper material.
Question 2
The diagram shows the effect of introducing a tariff on a product. price P2 P1 O quantity domestic supply domestic demand world supply plus tariff world supply What determines the producer surplus that the tariff generates for domestic producers?
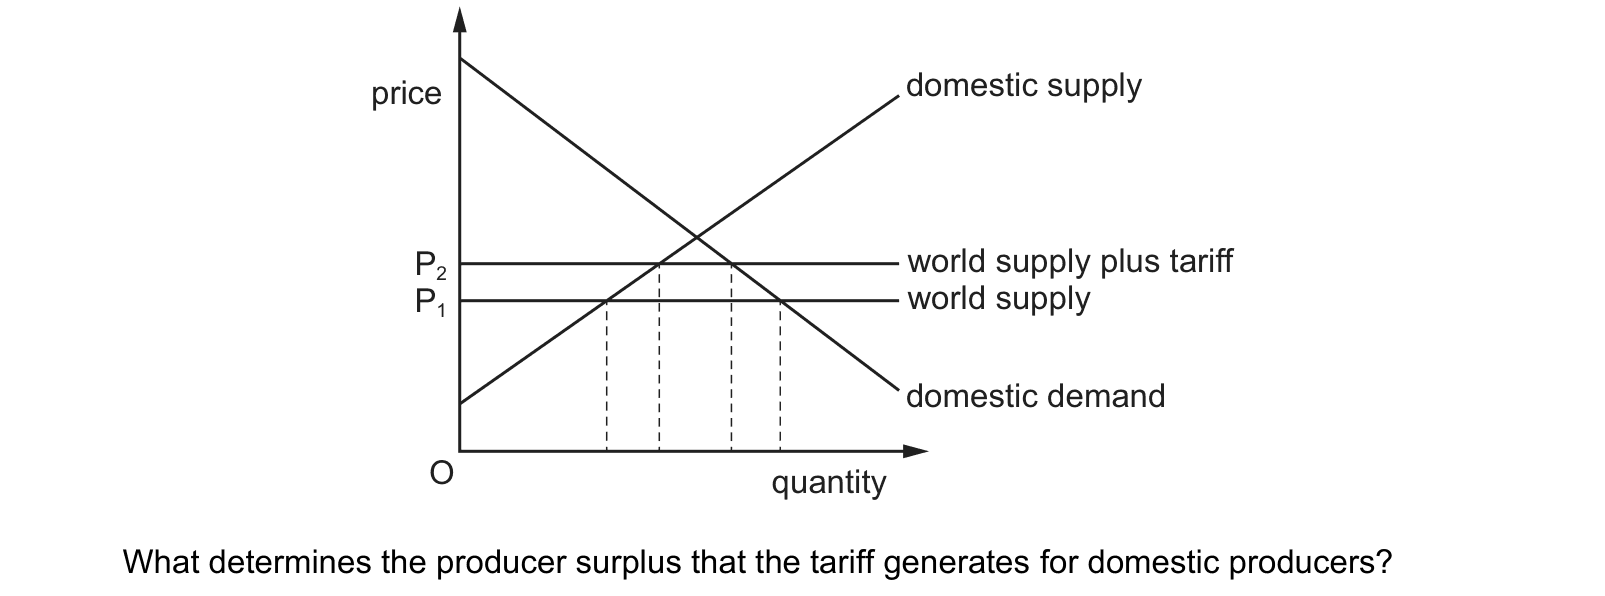
Answer: D.
Cross-board concept practice · originally a CIE 9708 question, used here because the concept is the same. It is not IB Economics past-paper material.
Question 3
A developing country experiences economic growth. The economic growth is most likely to lead to economic development when it
Answer: D.
What the syllabus asks for on this topicSyllabus points
Syllabus points
- Single indicators of development: health, education, income and others.
- Composite indicators, including the Human Development Index.
- Why no single measure is sufficient, and what each one leaves out.
- (HL) Further composite measures that adjust for inequality, gender and multidimensional poverty.
Related IB Economics topics
Not the topic you were looking for? Describe what you are stuck on in your own words and we will take you to the notes that answer it.